Discount Rate in Business Valuation
Among all the variables that determine the valuation of a business, few are as consequential as well as misinterpreted as is the discount rate. Any minor change in the discount rate can alter the estimated value of a company by tens of millions of dollars, but it is the kind of thing many finance professionals come across and see not so much as a number to be disputed and comprehended as an output. The training of real fluency in the discount rate of business valuation is thus not only a technical necessity – it is one of the most straightforward methods of giving rigour and credibility to any deal, advisory, or internal investment process by a finance professional.
In essence, the discount rate is the lowest rate that an investor would want to earn before he or she can commit his or her capital in a given business. It is based on the time value of money -the idea that a dollar today is worth more than a dollar tomorrow- and a premium reflecting the particular risks of that investment. Practically, to obtain a defensible discount rate involves delicate judgment on what the cost of equity is, what the cost of debt is, what the suitable capital structure is and a variety of size and company-specific risk adjustments that are often more of an art than a science.
The guide will be aimed at junior to mid-level finance professionals that want a systematic, practical insight into the process of constructing and applying discount rates in business valuation. It discusses the most important methodologies, typical problems, practical examples, and lessons. This will be an addition to the formal training of professionals who have professional training in the techniques of discounted cash flow valuation, and a solid conceptual and operational base on which to build on, to those more recent in the field of valuation.
Understanding What the Discount Rate Really Measures
The WACC (Weighted Average Cost of Capital) is the most common way of representing the discount rate applicable in business valuation. WACC is a combination of the cost of equity and the cost of debt (weighted by each capital source) in the companies capital structure to obtain one single rate that gives the overall rate of return needed by all capital sources. The rate of discounting of the projected future free cash flows to the present value is the DCF model, which is the most sensitive of all inputs in the whole valuation process.
Before trying to compute or use WACC, it is important to have a knowledge of the elements of the WACC. The cost of equity is commonly calculated through the Capital Asset Pricing Model (CAPM), which calculates the cost of equity by taking a risk premium, which is multiplied by the beta of the company, a measure of the systematic risk of the company, and then add it to a risk-free rate, often proxied by the yield on long-term government bonds. The cost of debt is typically easier to see directly, depending on the rate of interest at which the company will borrow, with the tax shield created by the interest on debt subtracted. A combination of these inputs will result in a rate that depicts the economic hurdle that the business has to overcome in order to generate value to its investors.
The real-life significance of doing this right could not be underestimated. Take an example of a manufacturing business that has an estimated free cash flow of USD 8 million per annum in five years and the terminal value will be USD 8 million in the fifth year. Using a WACC of 9% could provide a present value of about USD 180 million. Move that WACC up to 12 and the same cash flows can generate a value of more like USD 150 million – a difference of USD 30 million indicating solely the difference in the assumption of discount rate. This is the sensitivity that discount rate in business valuation is to be constructed with care in a manner that is evidence based and not a default to convenient round numbers.
Five Key Steps to Deriving a Defensible Discount Rate
It takes a systematic approach to establish a believable discount rate. Whether you are doing an acquisition, a fairness opinion or an internal decision on capital allocation, the five steps below give you a systematic way to go about the data gathering to come up with a supportable WACC conclusion.
| Step | Stage | Key Action |
| 1 | Determine the Risk-Free Rate. | Take the yield of a long run government bond (10 or 20 year) in the currency in which the cash flows being discounted are in. |
| 2 | Determine the Equity Risk Premium | Implement a country- and market-specific ERP; rely on the existing sources like a yearly survey presented by Damodaran or data collected by Duff and Phelps. |
| 3 | Select and Unlever Beta | Find a group of listed companies with which the subject company matches in terms of peer group, unleverage their beta to eliminate capital structure effects, and leverage it back to the structure of the subject company. |
| 4 | Apply Size and Specific Risk Premiums | Add small company size and company-specific risk premiums that are not measured by beta (key-person risk, customer concentration, etc.) |
| 5 | Compute After-tax cost of debt and WACC. | Calculate marginal cost of debt; tax shield; weight the costs of equity and debt by target capital structure values. |
All these steps entail the availability of good market information and a justifiable reason behind every decision that is made. Among the indicators of an effective WACC is the fact that all assumptions have a particular source and can be justified in case of a challenge. Practically, this involves maintaining a current date and source of data, dates and the process behind each choice – a science that is often reinforced throughout risk and treasury management training programmes such as that used in training working finance professionals.
Also worth noting is that the WACC is expected to indicate the capital structure that the business is likely to have during the forecast period, but not necessarily the current structure. In the case of a company, in the process of deleveraging after a leveraged buyout, e.g., the right WACC could change over the years as the debt is paid off. In some cases, some practitioners take this up with an adjusted present value (APV) treatment in its place, where the unlevered value of the business is isolated against the tax shield value of debt – a subtlety that is especially pertinent in the context of the private equity and restructuring.
CAPM, Beta, and the Challenge of Estimating Cost of Equity
Cost of equity is always the most controversial and subjective of all the WACC elements. The cost of equity as opposed to the cost of debt cannot be directly observed such as through the agreement of loans or through bond yields that can often be observed directly in the market, but rather must be determined through market data and model assumptions. The theoretical framework of the Capital Asset Pricing Model is applied, however, in reality it is a sequence of judgment calls, which, in essence, could very well influence the valuation.
Beta is the most disputed input maybe. In the case of listed companies, beta can be seen based on historical price data as compared to a market index but is inherently backward-looking and volatile as the measurement period taken. In the case of the private company – constituting a significant percentage of the business valuation tasks – beta should be approximated based on a similar group of peers in the market. Identifying peers, un-levering their betas to eliminate the impact of their own capital structures, calculating an average unlevered beta, and re-levering with the capital structure of the subject company, is a fundamental applied art taught in discounted cash flow valuation techniques classes and practiced in the context of actual engagements.
An example of the real world is used to explain the stakes. A specialty chemicals business the analyst is valuing is a mid-sized European company that chose a peer group of five listed companies. The equity betas were observed as between 0.85 and 1.45 – a big spread. Upon unlevering and averaging, the re-levered beta of the subject company was 1.10 which yielded a cost of equity of about 11.5%. The cost of equity would have been more similar to the actual 14% had the analyst input the highest peer beta, which would result in a materially lower valuation. One of the most relevant decisions of the whole model turned out to be the peer group selection decision, which is usually considered a ritual.
Table 1: WACC Sensitivity to Key Inputs
| Input Assumption | Conservative | Base Case | Aggressive | Value Impact |
| Risk-Free Rate | 3.5% | 4.0% | 4.5% | Moderate |
| Equity Risk Premium | 4.5% | 5.5% | 6.5% | High |
| Re-levered Beta | 0.90 | 1.10 | 1.35 | Very High |
| Small Company Premium | 1.0% | 2.0% | 3.5% | High |
| Resulting WACC (approx.) | 8.5% | 11.0% | 14.5% | — |
Practical Challenges, Risk Considerations, and Lessons Learned
In the real world of transactions, it is seldom as easy as the textbook would make it out to estimate a discount rate. There is a list of common issues that practitioners are constantly faced with and that challenge their technical expertise, as well as their professional judgment. Being aware of these issues beforehand, and familiar with how seasoned analysts avoid them, it is the best preparation that one can have when working in corporate finance, M&A advisory or valuation.
The treatment of country risk as a part of valuing businesses operating in, or receiving a significant amount of revenues in emerging or frontier markets is one of the most perennial challenges. A company based in a developed economy, but with 60 percent of its revenues on operations in South-East Asia, Sub-Saharan Africa or Latin America, will have risk exposures that will be understated by a standard WACC constructed on home-country inputs. The use of country risk premiums – the adjustments to accommodate the extra sovereign, currency, and political risks of doing business in such markets – involves data and judgment. Such layered risk adjustments are normally managed by professionals who have undergone thorough risk and treasury management training as compared to those who have gone through entry-level training in finance.
The second difficulty is in case capital structure of a subject company is changing. When a leveraged buyout is made, e.g., the debt-to-equity ratio moves significantly over the holding period as that debt is amortised. A constant WACC over a ten-year projection can thus distort value – especially in the initial years when leverage is greatest. This is being more and more tackled with models of iterative or APV, but each of these approaches has its own complexities. The moral of the story is that model sophistication should be accompanied by transparency in understanding the assumptions being made, and a readiness to discuss those decisions with clients, counterparties and investment committees.
Among the lessons learned is the third one, which states that there is a risk of anchoring the discount rate to a preferred valuation result. An implicit pressure to decrease the WACC inputs (to support a higher bid) is sometimes present in competitive auction processes. This is what this type of professional and ethical risk is all about: trained analysts who are well versed in the methodology are in a better position to have analytical independence and to barricade constructively when assumptions are being pushed beyond the evidence base that can support them.
Process Flow 1: WACC Calculation Workflow
| Stage 1 | Stage 2 | Stage 3 | Stage 4 | Stage 5 | Stage 6 |
| Set Risk-Free Rate | Estimate ERP | Select Peer Group & Beta | Add Size & Specific Premiums | Calculate After-Tax Cost of Debt | Blend into WACC |
| Govt bond yield (10–20 yr) | Damodaran / D&P data | Unlever → Average → Re-lever | Size, key-person, concentration | Marginal rate × (1 – tax rate) | Weight by target structure |
Process Flow 2: Discount Rate Review and Stress-Test Protocol
| Step 1 | Step 2 | Step 3 | Step 4 | Step 5 |
| Record all WACC sources and date. | Run sensitivity: WACC ±1%, ±2% | Multiple vs market comps were implied by cross-check. | Test country risk and currency overlays | Current, not one point, in deliverable. |
Applying Discount Rates Across Different Valuation Contexts
The correct discount rate is not universal in the sense that it varies significantly with the objective of the valuation, the type of cash flows being discounted and the risk profile of the subject entity. These contextual differences are one of the indicators of an experienced practitioner and are taught in detail in the training programmes of advanced discounted cash flow valuation techniques.
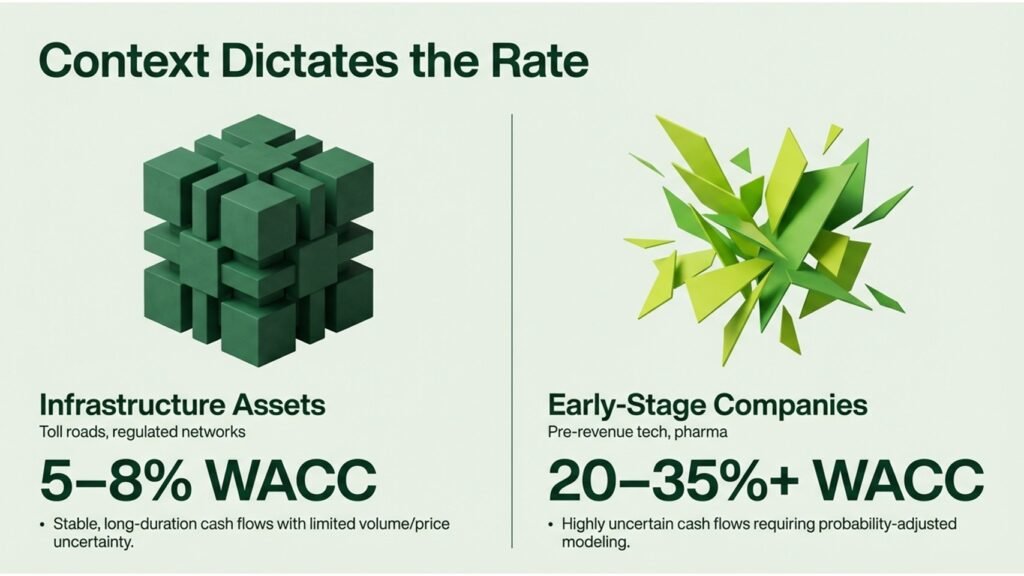
When a company is in its early stages, or the cash flows it generates are very uncertain (e.g. technology companies before they generate cash or pharmaceutical companies before they are approved by regulatory agencies), the standard WACC based on listed-company betas may underestimate the actual risk. In such situations, the practitioners occasionally complement WACC by a venture capital rate of return methodology, or use probability-adjusted scenario analysis to explicitly model the distribution of potential outcomes. In such environments, the discount rate can be as high as 20-35, which represents the true uncertainty that is associated with the estimated cash flows.
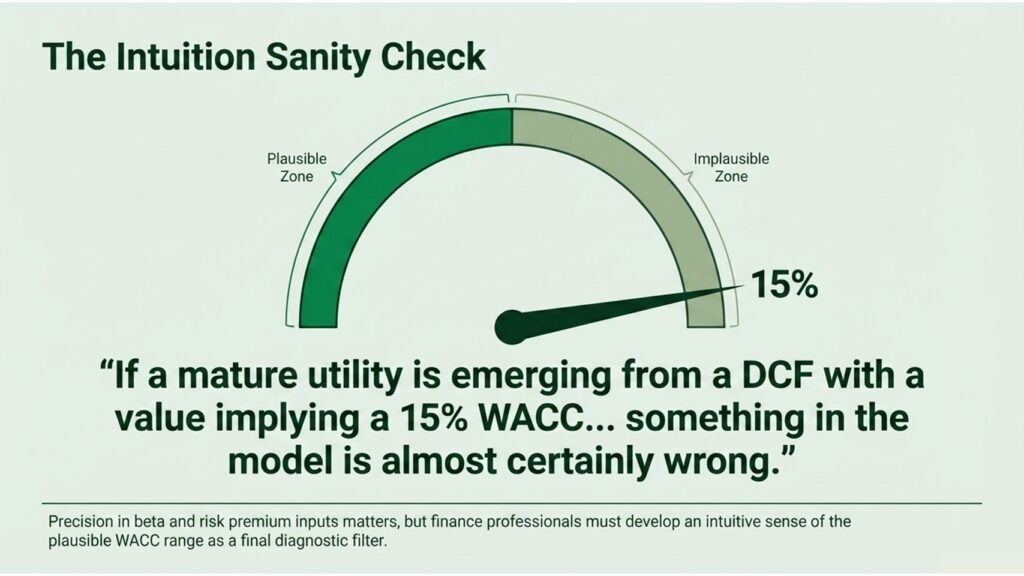
In comparison, infrastructure assets such as toll roads, utilities, regulated networks have stable and long-duration cash flows, and low volume and price risk. In this case, WACCs typically lie between 5-8 percent and the accuracy of the inputs of the beta and risk premium does not have as dramatic implications as in more volatile sectors. The practical implication is that the finance professional is supposed to form an intuitive idea of the possible range of the WACC of a particular sector and apply the intuition as a sanity check on the output of any given model. When a mature utility is coming out of a DCF that has a value suggesting a 15% WACC, then there is most definitely something wrong in the model.
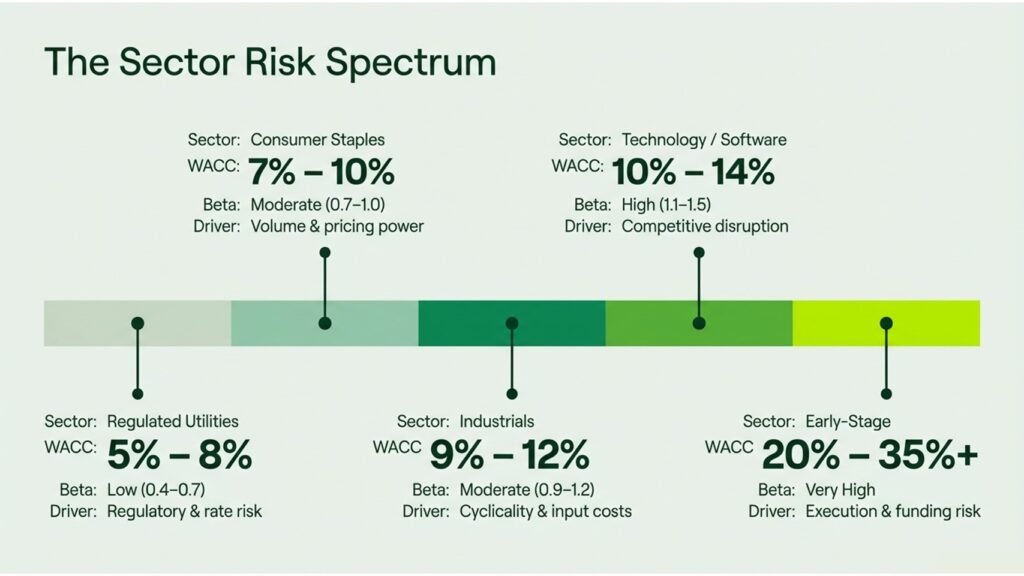
Table 2: Indicative WACC Ranges by Sector (Illustrative)
| Sector | Typical WACC Range | Key Risk Driver | Beta Profile |
| Regulated Utilities / Infrastructure | 5% – 8% | Regulatory & rate risk | Low (0.4–0.7) |
| Consumer Staples / FMCG | 7% – 10% | Volume & pricing power | Moderate (0.7–1.0) |
| Industrials / Manufacturing | 9% – 12% | Cyclicality & input costs | Moderate (0.9–1.2) |
| Technology / Software | 10% – 14% | Competitive disruption | High (1.1–1.5) |
| Early-Stage / Pre-Revenue | 20% – 35%+ | Execution & funding risk | Very High / N/A |
Conclusion: Actionable Insights for Finance Professionals
The only variable that can relate risk to value in any business valuation in a powerful way is the discount rate. It takes technical knowledge, market data, sound judgment, and intellectual standing to take a position and resist the temptation to tilt inputs in such a way they cannot be proved to be defensibly correct. Investing in a significant study of discount rate in business valuation is a most profitable undertaking to professionals in the early and middle levels of their finance careers.
This can be expedited by several handy measures. To start with, develop the habit of breaking down any WACC that you come across, be it in a model that you have been given, a transaction announcement, or a case study in the scholarly literature, into its various constituents. Questions to ask include: What was the source of the risk-free rate, how did the estimate of beta come about, what was the peer group and was the capital structure assumption realistic. This practice of analysis builds analytical instincts that make a trusted analyst stand out as opposed to an analyst who views the discount rate as a black box.
Second, invest in facilitated learning. Official education in discounted cash flow valuation techniques offers the conceptual soundness and practical model-building experience that helps develop the skills of this field more quickly than most on-the-job experiences can achieve. Equally, risk and treasury management training programmes develop the overall risk context in which discount rates should be interpreted; including country risk, currency risk, interest rate contexts, and relationship between corporate financing choices and the cost of capital.
Third, when producing each and every valuation deliverable, consider the discount rate as a range, not a point estimate. Letting a sensitivity table, indicating the change in enterprise value with WACC changing in 100-basis-point blocks, appear well presented, is not an indicator of uncertainty or lack of analytic strength. It is proving of rigour and intellectual honesty which will not be disrespected by experienced counterparties. The purpose of any valuation is not to give a single figure but to give a range of figures that can be defended in which the true value of the business is most apt to fall and the discount rate is at the core of that exercise.
Lastly, it is important to remember that the art of discount rate in business valuation is not in a vacuum. It is a part of a larger analysis tool that also incorporates revenue forecasting, margin analysis, capital structure optimisation and market positioning assessment. Those professionals who know how all these ties up, and can make clear to clients, colleagues, and decision-makers how to tie them up, will discover that the art of mastering the discount rate is not merely a technical feat, but a source of true advisory credibility.